|
|
||
|---|---|---|
| .. | ||
| dashboard.json | ||
| README.md | ||
| screenshot.png | ||
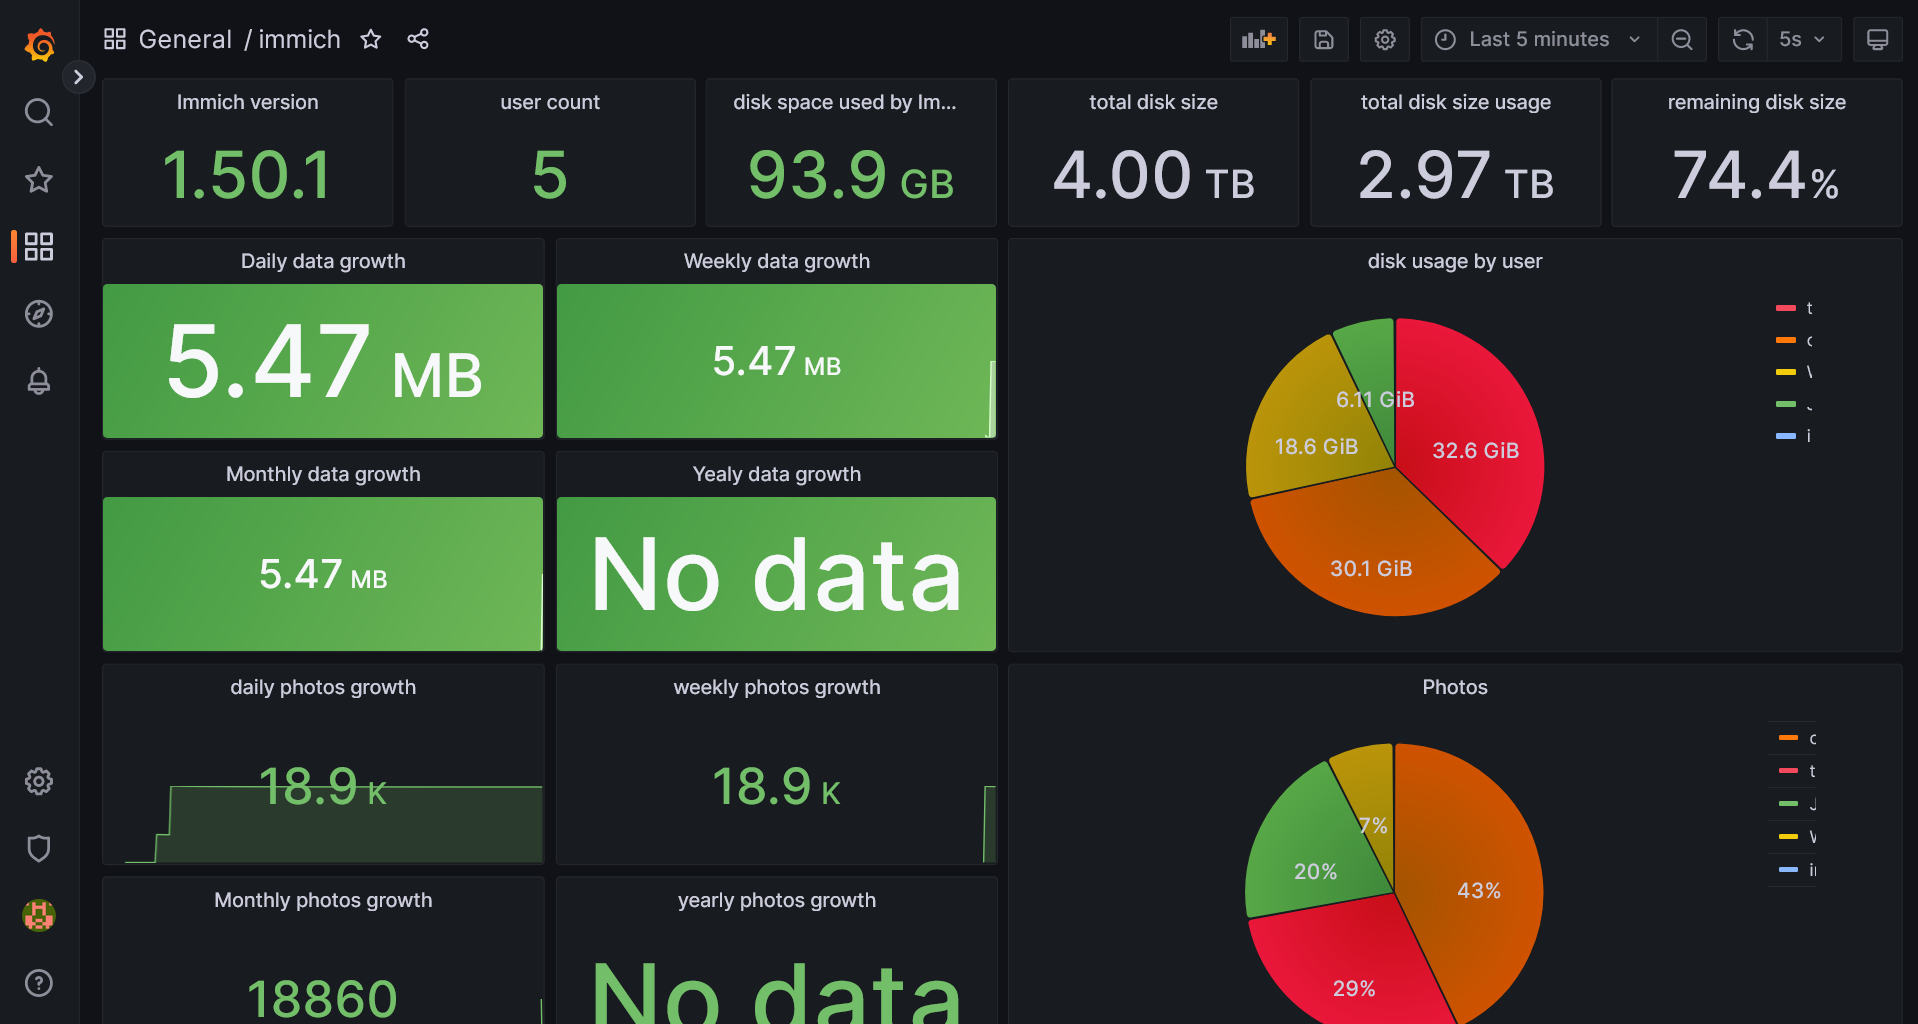
Grafana dashboard
Import
To import the dashboard into your grafana, download the dashboard.json file and import it into your server. Select your prometheus instance and that should be all.
The graphs can be customized in their relative time. Mind that it takes time to populate them if you set relative time to monthly or yearly
| Relative time | entry |
|---|---|
the current day so far |
now/d |
the current week |
now/w |
current month |
now/M |
current year |
now/y |
