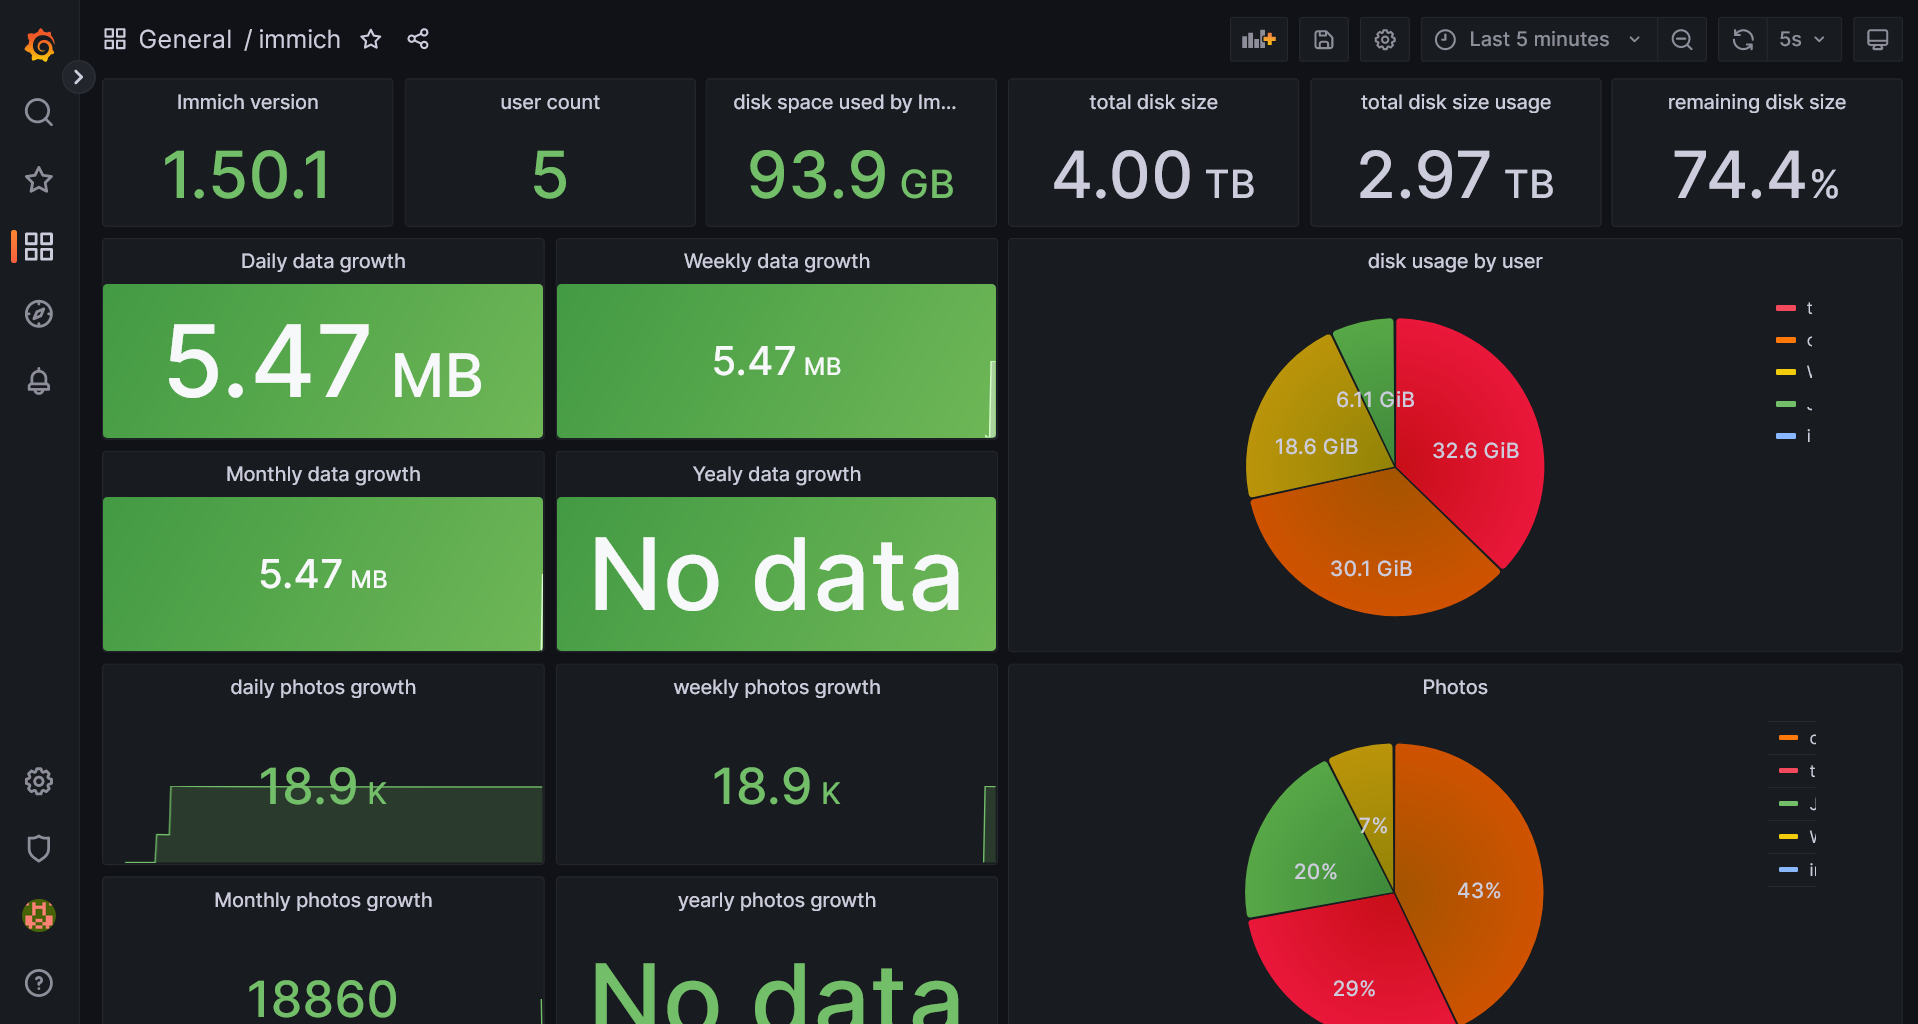
- Formated text to make it consistent - Changed hours/days/month/year to use 1d/1w/4w/1y - Changed Weekly data growth to use 1w to show the last 7 days. - Changed Monthly data growth to use 4w to show the last 4 weeks. - Changed Yearly data growth to use 1y to show the last 1y. - Added Photos growth last year visual - Added Videos growth last year visual - Corrected some spelling errors in 'expr' so that the values are now calculated correctly |
||
|---|---|---|
| .. | ||
| dashboard-immich.json | ||
| README.md | ||
| screenshot.png | ||
Grafana dashboard
Import
To import the dashboard into your grafana, download the dashboard.json file and import it into your server. Select your prometheus instance and that should be all.
The graphs can be customized in their relative time. Mind that it takes time to populate them if you set relative time to monthly or yearly
| Relative time | entry |
|---|---|
the current day so far |
now/d |
the current week |
now/w |
current month |
now/M |
current year |
now/y |
