No description
| .github/workflows | ||
| grafana | ||
| .gitignore | ||
| CHANGELOG.md | ||
| docker-compose.yml | ||
| Dockerfile | ||
| entrypoint.sh | ||
| LICENSE | ||
| package.json | ||
| README.md | ||
| requirements.txt | ||
| restic-exporter.py | ||
ngosang/restic-exporter
Prometheus exporter for the Restic backup system.
Install
Form source code
Requirements:
- Python 3
- prometheus-client
pip install -r /requirements.txt

export RESTIC_REPO_URL=/data
export PASSWORD_FILE=/restic_password_file
python restic-exporter.py
Docker
Docker images are available in GHCR and DockerHub.
docker pull ghcr.io/ngosang/restic-exporter
or
docker pull ngosang/restic-exporter
Supported Architectures
The architectures supported by this image are:
- linux/386
- linux/amd64
- linux/arm/v6
- linux/arm/v7
- linux/arm64/v8
- linux/ppc64le
- linux/s390x
docker-compose
Compatible with docker-compose v2 schemas:
---
version: '2.1'
services:
  restic-exporter:
    image: ngosang/restic-exporter
    container_name: restic-exporter
    environment:
      - TZ=Europe/Madrid
      - RESTIC_REPO_URL=/data
      - RESTIC_REPO_PASSWORD=<password_here>
      # - RESTIC_REPO_PASSWORD_FILE=</file_with_password_here>
      - REFRESH_INTERVAL=1800 # 30 min
    volumes:
      - /host_path/restic/data:/data
    ports:
      - "8001:8001"
    restart: unless-stopped
docker cli
docker run -d \
  --name=restic-exporter \
  -e TZ=Europe/Madrid \
  -e RESTIC_REPO_URL=/data \
  -e RESTIC_REPO_PASSWORD=<password_here> \
  -e REFRESH_INTERVAL=1800 \
  -p 8001:8001 \
  --restart unless-stopped \
  ngosang/restic-exporter
Configuration
All configuration is done with environment variables.
RESTIC_REPO_URL: Restic repository URL. It could be a local repository (eg:/data) or a remote repository (eg:rest:http://user:password@127.0.0.1:8000/).RESTIC_REPO_PASSWORD: Restic repository password in plain text. This is only required ifRESTIC_REPO_PASSWORD_FILEis not defined.RESTIC_REPO_PASSWORD_FILE: File with the Restic repository password in plain text. This is only required ifRESTIC_REPO_PASSWORDis not defined. Remember to mount the Docker volume with the file.REFRESH_INTERVAL: (Optional) Refresh interval for the metrics in seconds. Computing the metrics is a expensive task, keep this value as high as possible. Default 60LISTEN_PORT: (Optional) The address the exporter should listen on. The default is8001.LISTEN_ADDRESS: (Optional) The address the exporter should listen on. The default is to listen on all addresses.LOG_LEVEL: (Optional) Log level of the traces. The default isINFO.
Exported metrics
# HELP restic_check_success Result of restic check operation in the repository
# TYPE restic_check_success gauge
restic_check_success 1.0
# HELP restic_snapshots_total Total number of snapshots in the repository
# TYPE restic_snapshots_total counter
restic_snapshots_total 1777.0
# HELP restic_backup_timestamp Timestamp of the last backup
# TYPE restic_backup_timestamp gauge
restic_backup_timestamp{client_hostname="PC-HOME-1",client_username="PC-HOME-1\\User-1",snapshot_hash="1911eb846f1642c327936915f1fad4e16190d0ab6b68e045294f5f0280a00ebe"} 1.669754009e+09
# HELP restic_backup_files_total Number of files in the backup
# TYPE restic_backup_files_total counter
restic_backup_files_total{client_hostname="PC-HOME-1",client_username="PC-HOME-1\\User-1",snapshot_hash="1911eb846f1642c327936915f1fad4e16190d0ab6b68e045294f5f0280a00ebe"} 19051.0
# HELP restic_backup_size_total Total size of backup in bytes
# TYPE restic_backup_size_total counter
restic_backup_size_total{client_hostname="PC-HOME-1",client_username="PC-HOME-1\\User-1",snapshot_hash="1911eb846f1642c327936915f1fad4e16190d0ab6b68e045294f5f0280a00ebe"} 4.1174838248e+010
# HELP restic_backup_snapshots_total Total number of snapshots
# TYPE restic_backup_snapshots_total counter
restic_backup_snapshots_total{client_hostname="PC-HOME-1",client_username="PC-HOME-1\\User-1",snapshot_hash="1911eb846f1642c327936915f1fad4e16190d0ab6b68e045294f5f0280a00ebe"} 106.0
Prometheus config
Example Prometheus configuration:
scrape_configs:
  - job_name: 'restic-exporter'
    static_configs:
      - targets: ['192.168.1.100:8001']
Prometheus / Alertmanager rules
Example Prometheus rules for alerting:
  - alert: ResticCheckFailed
    expr: restic_check_success == 0
    for: 5m
    labels:
      severity: critical
    annotations:
      summary: Restic check failed (instance {{ $labels.instance }})
      description: Restic check failed\n  VALUE = {{ $value }}\n  LABELS = {{ $labels }}

  - alert: ResticOutdatedBackup
    # 1209600 = 15 days
    expr: time() - restic_backup_timestamp > 1209600
    for: 0m
    labels:
      severity: critical
    annotations:
      summary: Restic {{ $labels.client_hostname }} / {{ $labels.client_username }} backup is outdated
      description: Restic backup is outdated\n  VALUE = {{ $value }}\n  LABELS = {{ $labels }}
Grafana dashboard
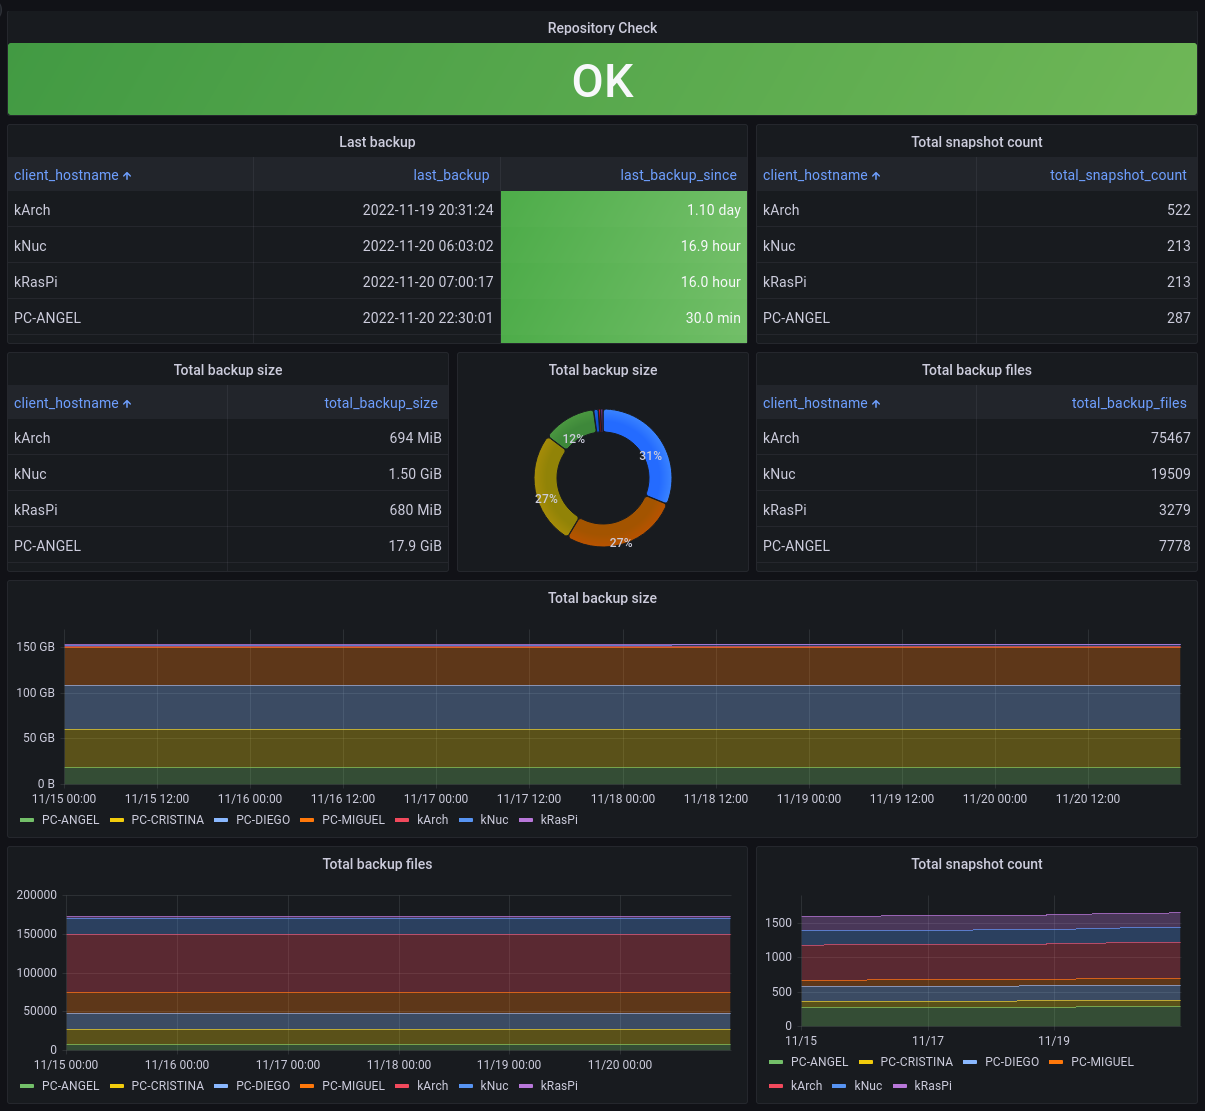
There is a reference Grafana dashboard in grafana/grafana_dashboard.json.


