The file used in the `scrape_configs` of prometheus has a wrong name compared to the previous example. |
||
|---|---|---|
| docker_handler.go | ||
| docker_handler_test.go | ||
| Dockerfile | ||
| go.mod | ||
| go.sum | ||
| main.go | ||
| Makefile | ||
| metrics.go | ||
| overall-diagram.png | ||
| prom_file_handler.go | ||
| README.md | ||
| utils.go | ||
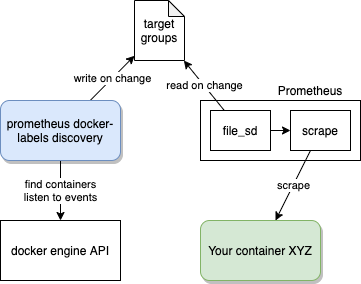
Discover docker containers to scrape based on labels
This tool aims at discovering containers running
with prometheus.io/scrape=true annotations
from a given docker engine, and auto-configure prometheus for scraping.
This tool is standalone and write the discovered containers (services) in a file, which is in turn passed to Prometheus file service discovery to start the scraping jobs.
Example via a docker-compose
The following part is giving a complete example of configuring the docker-labels discovery mechanism. It is based in three parts, namely:
- Configure prometheus-docker-labels-discovery
- Configure Prometheus file_sd_configs
- Configure your services
Configure prometheus-docker-labels-discovery
  prometheus-docker-labels-discovery:
    image: sqooba/prometheus-docker-labels-discovery:v1
    restart: unless-stopped
    networks:
      - monitoring_default # make sure this network exists and is connected to prometheus
#    ports:
#      - "8080"
    security_opt:
      - no-new-privileges:true
    volumes: # Mount the JSON file that will be exchanged with prometheus
      - ./from-docker-labels.json:/tmp/from-docker-labels.json
    environment:
      - PROMETHEUS_CONFIG_FILE_PATH=/tmp/from-docker-labels.json
      - DOCKER_NETWORK_NAME=bridge
      - PROMETHEUS_COMMON_LABELS=commonlabel1=commonvalue1
Configure Prometheus
Prometheus needs to be configured using file_sd_configs scrape config.
scrape_configs:
- job_name: 'docker-labels-sd'
  file_sd_configs:
  - files:
    - 'from-docker-labels.json'
Configure your services
Any service can now be configured using docker labels. The following example shows in docker-compose style how this looks like:
services:
  test-metrics:
    image: dummy-metrics:v1
    labels:
      - "prometheus.io/scrape=true"
      - "prometheus.io/path=/metrics"
      - "prometheus.io/extra-labels=k1:v1,k2:v2"
The exhaustive list of labels to configure properly your service is provided below:
| Annotation | Definition | Example |
|---|---|---|
prometheus.io/scrape |
Main label to ensure this container will be scraped by Prometheus. Required value is true. Any other value will not be considered. |
prometheus.io/scrape=true |
prometheus.io/port |
Specify which port to use for the scraping. In case of a single port exposed, this configuration can be omitted. | prometheus.io/port=8080 |
prometheus.io/path |
Alternative path for scraping the metrics. Default from Prometheus is /. |
prometheus.io/path=/metrics |
prometheus.io/scheme |
Alternative scheme for scraping thee metrics. Default from Prometheus is http. |
prometheus.io/scheme=https |
prometheus.io/extra-labels |
Any extra labels to add to the metrics scraped for this container. Comma separated key:value pairs. | prometheus.io/extra-labels=label1:value1,label2:value2,... |